Are you planning to buy Hostinger Shared Hosting and worried about Hostinger shared hosting speed and performance?
In this blog post, we will test Hostinger shared hosting speed and performance with very different parameters and you can decide whether Hostinger is good or not for your website.
Hostinger Shared Hosting
Hostinger was established in 2004 in Kaunas, Lithuania. Hostinger is a very popular shared hosting provider. There 29 million customers of Hostinger and they are adding daily 15k+ customers every day. Recently Hostinger has seen very much growth in the hosting market. Cheap Pricing and Speed are the main reasons for Hostinger Popularity.
Hostinger provides Shared Hosting, WordPress Hosting, Cloud Hosting, VPS Hosting, and other hostings. Hostinger also provides Domains, Website builder, and Email hosting such as Google Workspace and Titan Email hosting.
In this blog post we will mainly talk about Hostinger Shared Hosting.
Plans & Pricing
Hostinger shared hosting offers 3 different plans. Hostinger plans start from 1.39$ per month to 3.99$.
Testing Environment
To test Hostinger shared hosting speed, I bought a Premium Shared Hosting plan. Honestly, If you want to buy Hostinger shared hosting you should not choose a Basic plan. Because it will not perform and good and you will able to host only one website.
But with the premium plan, you will able to host unlimited websites, and also you will get a free domain for 1 year. If you have a budget for a Business Shared Hosting plan, you should go with it.
I preferred the middle plan, as most people choose a middle plan. And I think there is no major difference in Premium and Business Plan except Daily Backups, storage, and Server specifications.
After that, I installed the WordPress website. I want to get the best accurate results, so I did not want to test a blank WordPress website.
So, I installed Blocksy free theme from WordPress respiratory. and I installed a starter site of Blocksy Theme called Tasty.
Testing Website Details
Before starting the test, I want to inform you that I have not paid by any of the hosting companies. You can use my affiliate links to purchase hosting, which will help me to do more honest tests.
I did multiple tests to get the best accurate results. If you want to see the final results you can click on the below button. One more thing, I have attached screenshots of all the tests, for the transparency between me and my lovely readers. Also, I have not manipulated any test results to earn affiliate commissions ????!
Now, lets start testing.
TTFB Test
First test we are going to is TTFB Test.
TTFB stands for time to first byte. To put it simply, this is a measurement of how long the browser has to wait before receiving its first byte of data from the server. The longer it takes to get that data, the longer it takes to display your page.
TTFB depends on the Hosting server, Themes, and plugins. But most of the part is played by the hosting server. If hosting using high performance server you will get low TTFB and if hosting is using low specifications server then it will be high.
Shared hosting stores your website files in a single location. From that server, the hosting will send all the files to the visitors. If your hosting server is located in the USA, then your website will get very low TTFB in the USA, Canada, and European countries. But it will be much higher in Asia and Australia.
Test 1
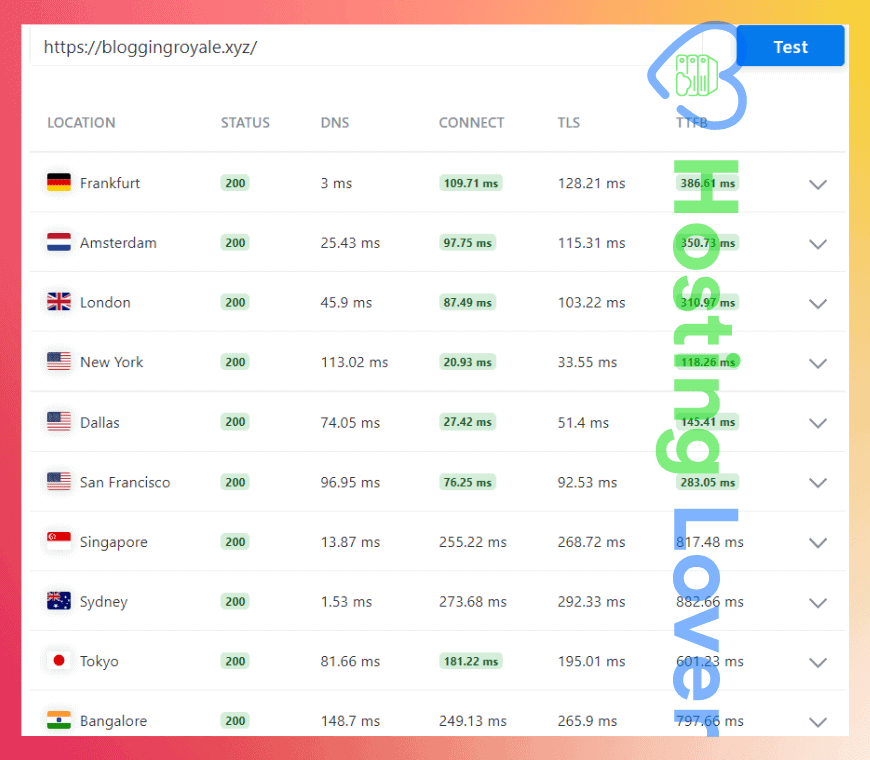
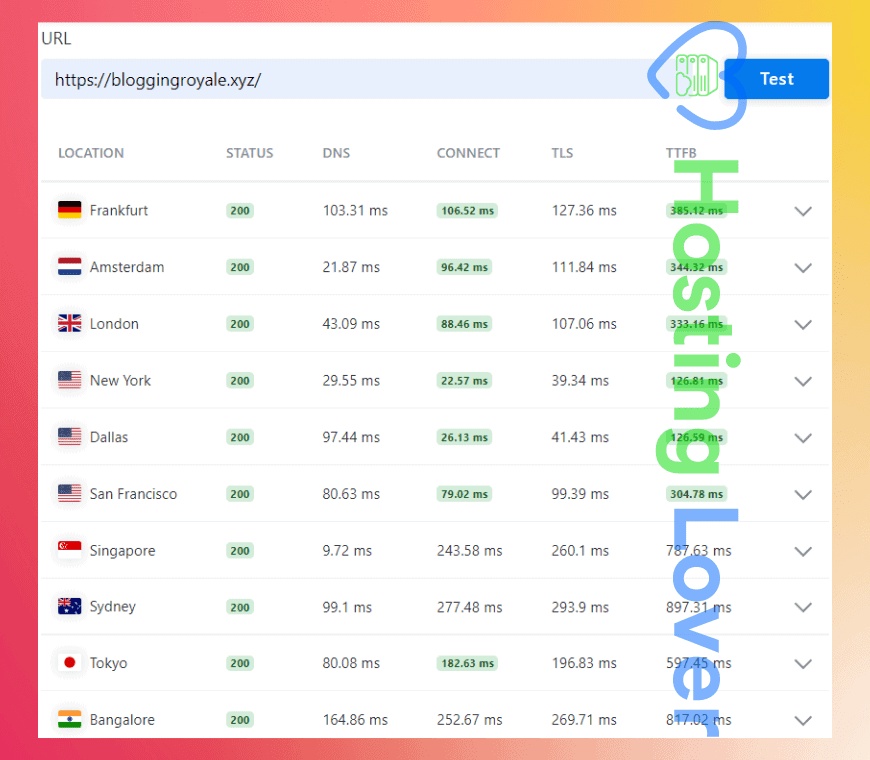
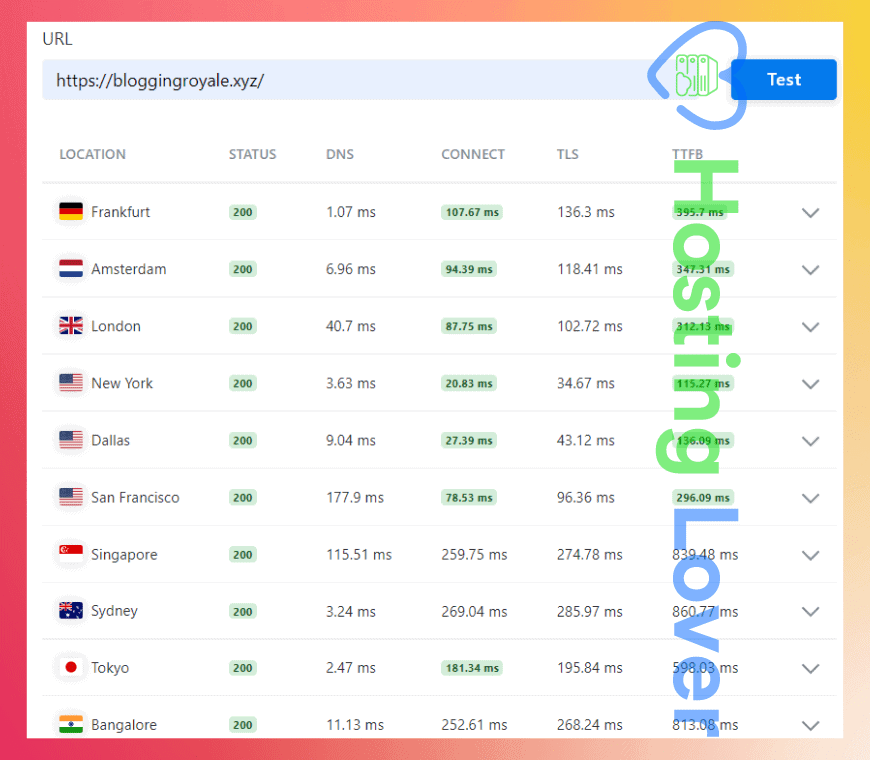
In test 1, I take 3 different results from different days. In test 1, You can see TTFB from various 10 locations, so you can see global performance of Hostinger Shared Hosting.
| Server Location | Test 1 | Test 2 | Test 3 |
|---|---|---|---|
| Frankfurt | 386 ms | 385 ms | 395 ms |
| Amsterdam | 350 ms | 344 ms | 347 ms |
| London | 310 ms | 333 ms | 312 ms |
| New York | 118 ms | 126 ms | 115 ms |
| Dallas | 145 ms | 126 ms | 136 ms |
| San Francisco | 283 ms | 304 ms | 296 ms |
| Singapore | 817 ms | 787 ms | 839 ms |
| Sydney | 882 ms | 897 ms | 860 ms |
| Tokyo | 601 ms | 597 ms | 598 ms |
| Bangalore | 797 ms | 817 ms | 813 ms |
| Global Average | 468 ms | 471 ms | 471 ms |
Test 2
Test 2 is done in GT Metrix from 7 different worldwide locations.
| Server Location | TTFB |
|---|---|
| Vancouver, Canada | 374 ms |
| Hong Kong, China | 742 ms |
| London, UK | 384 ms |
| Mumbai, India | 808 ms |
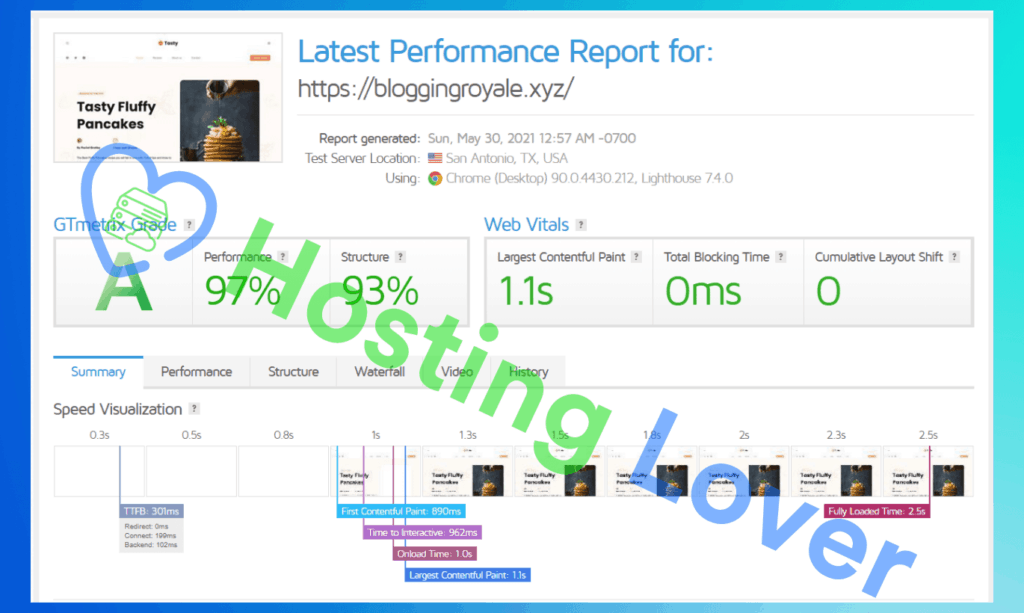
| San Antonio, TX, USA | 301 ms |
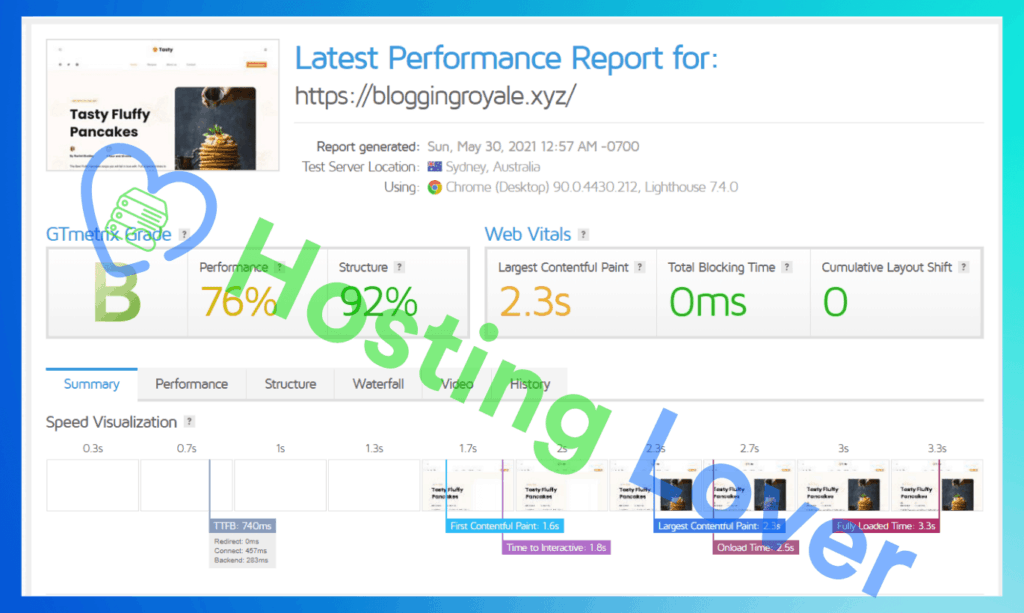
| Sydney, Australia | 740 ms |
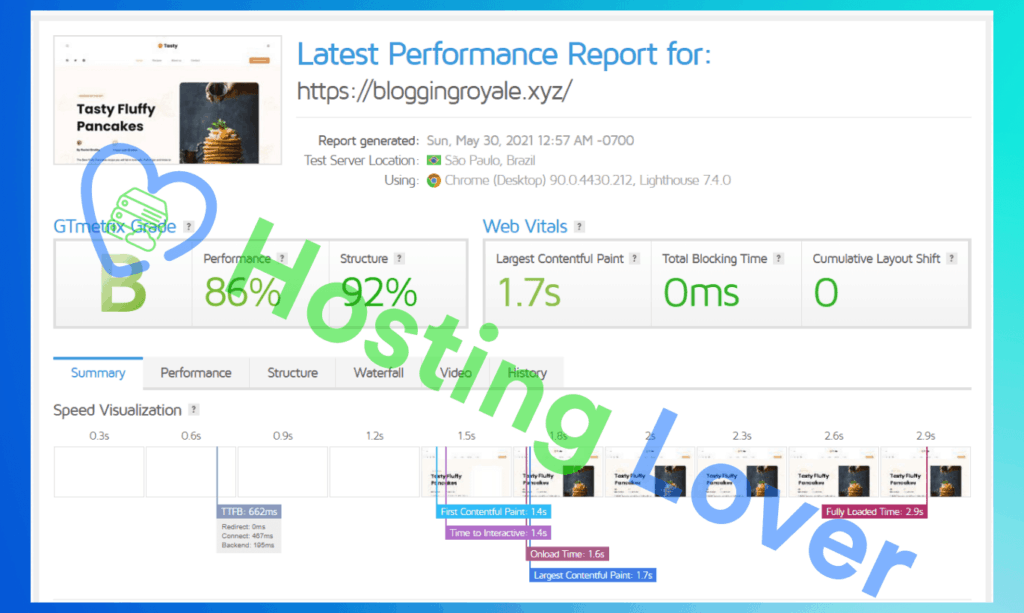
| São Paulo, Brazil | 662 ms |
| Global Average | 573 ms |
You can clearly see that Hostinger performed very well in the USA, Canada, and Europe. But TTFB in Asia, South America, and Australia. Unfortunately, GT Metrix does not offer any African location, but we can assume that it will be higher than Europe and lower than Asia.
Test 3
This is the most intimated test of TTFB Tests. I tested TTFB from 18 different worldwide locations.
| Server Location | TTFB |
|---|---|
| S Africa | 786 ms |
| Sweden | 578 ms |
| India | 821 ms |
| France | 396 ms |
| England | 390 ms |
| Ireland | 419 ms |
| S Korea | 737 ms |
| Bahrain | 833 ms |
| Japan | 619 ms |
| Brazil | 506 ms |
| Canada | 217 ms |
| Hong Kong | 700 ms |
| Singapore | 779 ms |
| Australia | 1553 ms |
| Germany | 425 ms |
| USA (VA) | 248 ms |
| USA (OH) | 191 ms |
| USA (OR) | 329 ms |
| Global Average | 584 ms |
By seeing the results of Test 3, we can say that Hostinger has performed very well in North America, Europe, and South America. The performance in Asia, Australia, and Africa is average.
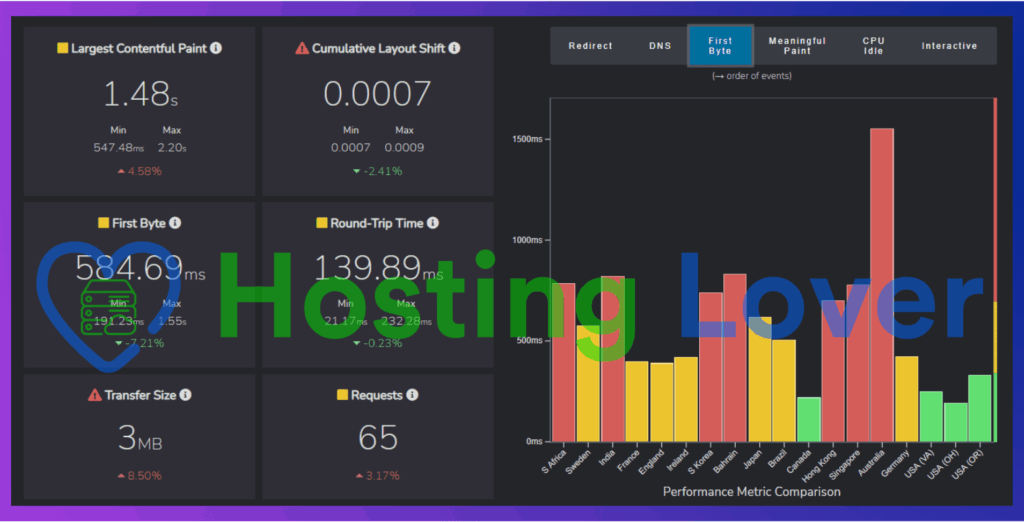
By seeing these test results, we can say that Hostinger performs very well in TTFB Test. The results of North America, South America, and Europe are pretty fast and awesome.
But in Asia, Australia, and Africa it is average.
Why this happened?
Because I have chosen my website server location from the USA. Currently, Hostinger offers 7 different locations. You have to choose the server which is nearest to your most of audience. For example, if your website is in the German language then without any doubt you have to choose European servers.
Hostinger Server locations of Hostinger:
- UK
- US
- Brazil
- Netherlands
- Singapore
- Indonesia
Lithuania (coming soon)
Okay, by doing these multiple tests we can give average results of TTFB of Hostinger Shared Hosting, Now let’s move on to Speed Test.
Speed Test
In the Speed Test, we will do 5 different tests and also measure core web vitals. By doing these tests we can see the total loading time of the website.
Test 1
Test 1 is done in Google Pagespeed insights. Pagespeed insights test results can be inconsistent. So, I took 1 test daily for 3 days. I want to get the best accurate results, so you can find the performance of the Hostinger Shared Hosting.
Yikes, there are more figures of this test results than the maths book. So, I created average results tests, you can check those results directly.
Mobile
Nowadays, most of the internet users are from mobiles. So, mobile speed is the most important factor for your website. Google Pagespeed measure mobile results separately, so here is the mobile test results.
| Metrics | Test 1 | Test 2 | Test 3 | Average |
|---|---|---|---|---|
| Score | 89 | 91 | 91 | 90 |
| First Contentful Paint | 2.5 s | 2.5 s | 2.5 s | 2.5 s |
| Time to Interactive | 3.7 s | 3.6 s | 3.6 s | 3.6 s |
| Speed Index | 2.6 s | 4.0 s | 3.0 s | 3.2 s |
| Total Blocking Time | 230 ms | 170 ms | 170 ms | 190 |
| Largest Contentful Paint | 2.5 s | 2.5 s | 2.5 s | 2.5 s |
| Cumulative Layout Shift | 0.003 | 0.003 | 0.003 | 0.003 |
Desktop
These test results are from Google Pagespeed insights desktop test.
| Metrics | Test 1 | Test 2 | Test 3 | Average |
|---|---|---|---|---|
| Score | 97 | 96 | 99 | 97 |
| First Contentful Paint | 0.7 s | 0.7 s | 0.7 s | 0.7 s |
| Time to Interactive | 1.0 s | 0.8 s | 0.7 s | 0.8 s |
| Speed Index | 1.3 s | 1.5 s | 0.9 s | 1.2 s |
| Total Blocking Time | 70 ms | 20 ms | 0 ms | 30 ms |
| Cumulative Layout Shift | 0.001 | 0.001 | 0.001 | 0.001 |
Test 2
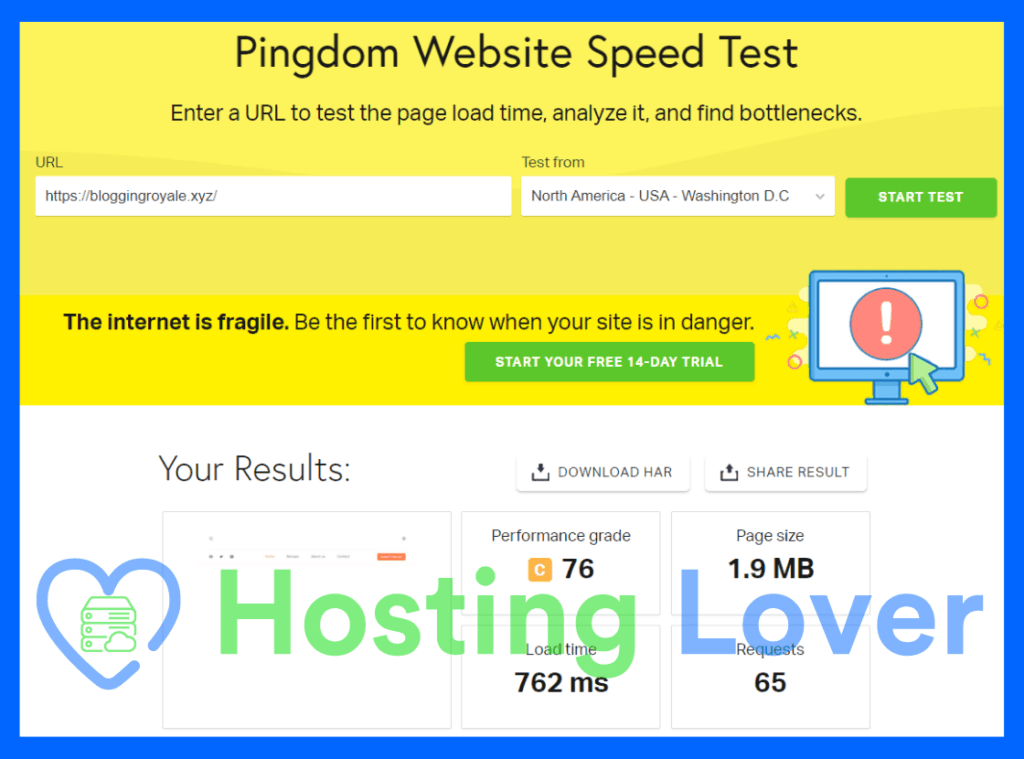
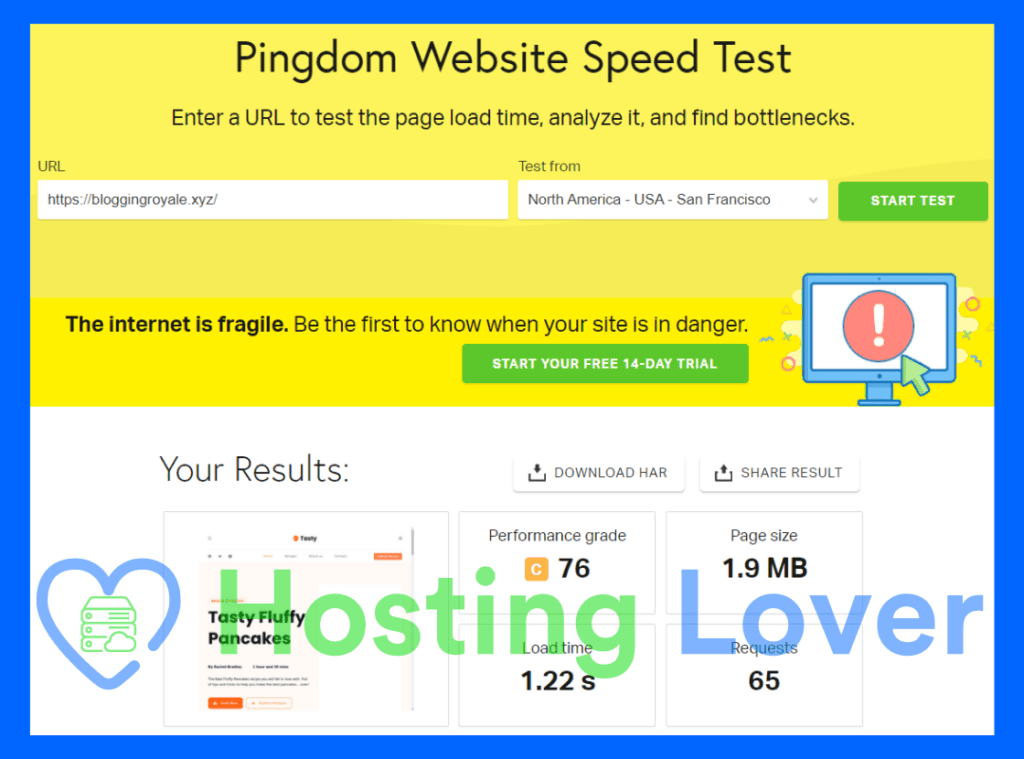
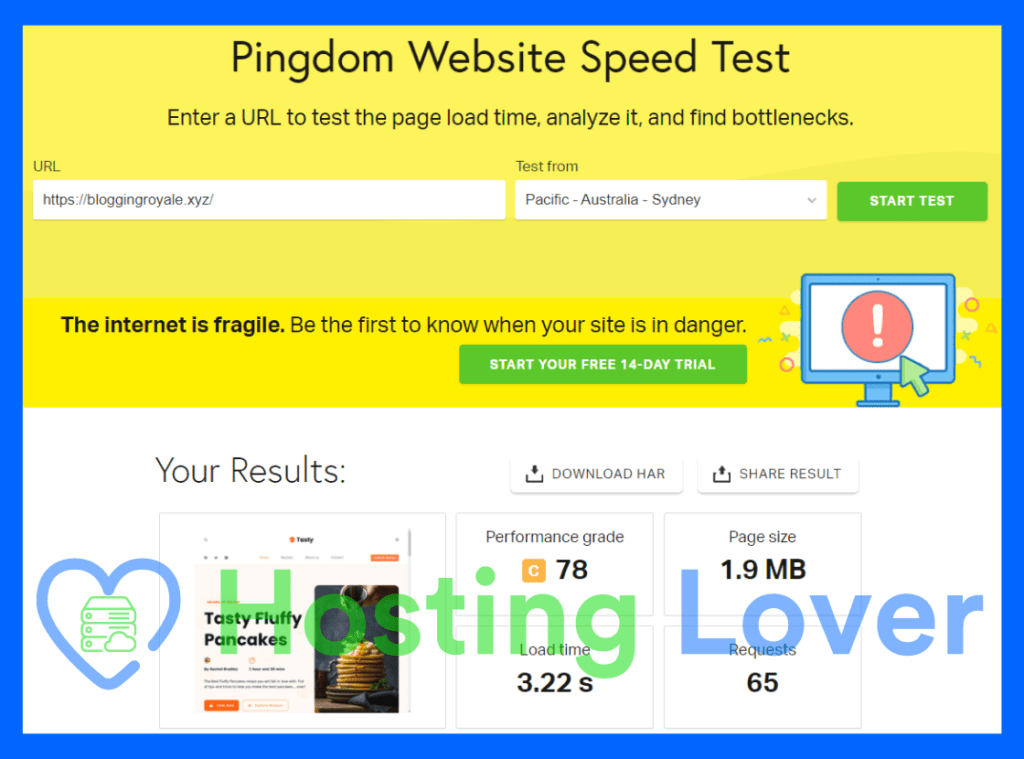
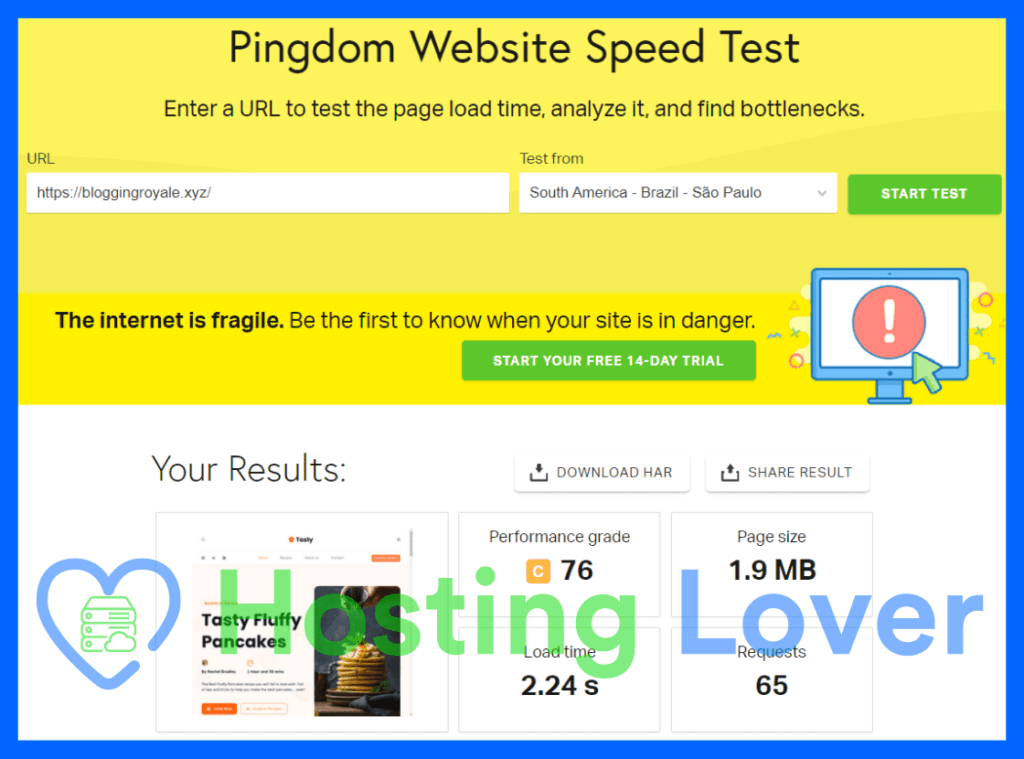
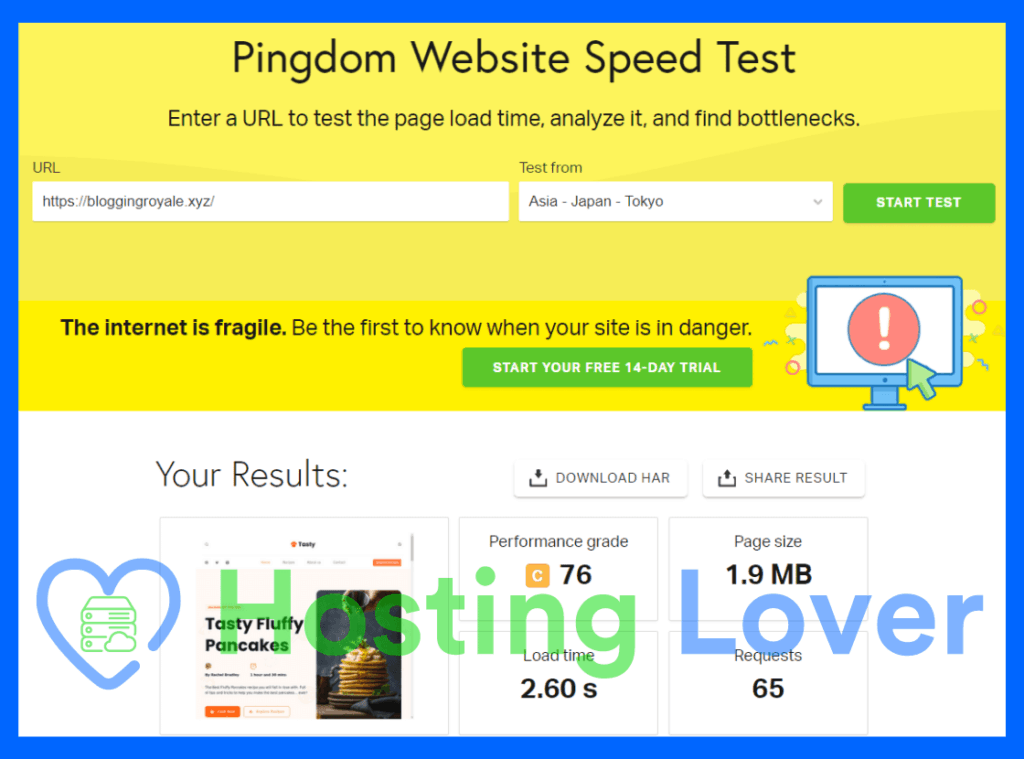
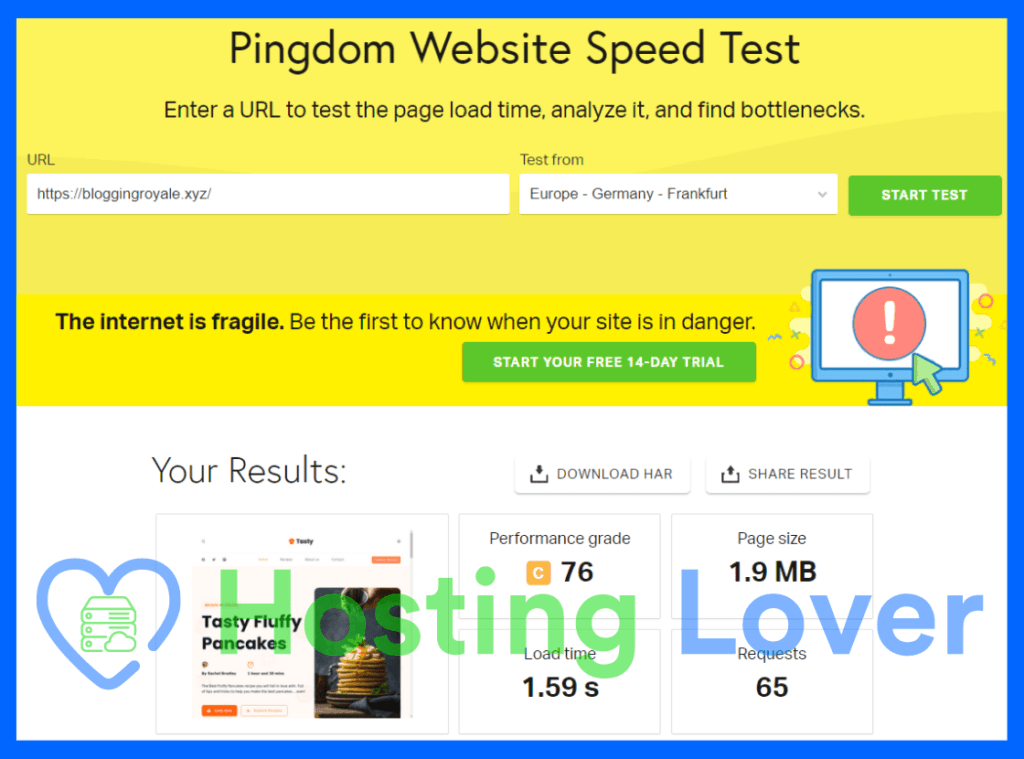
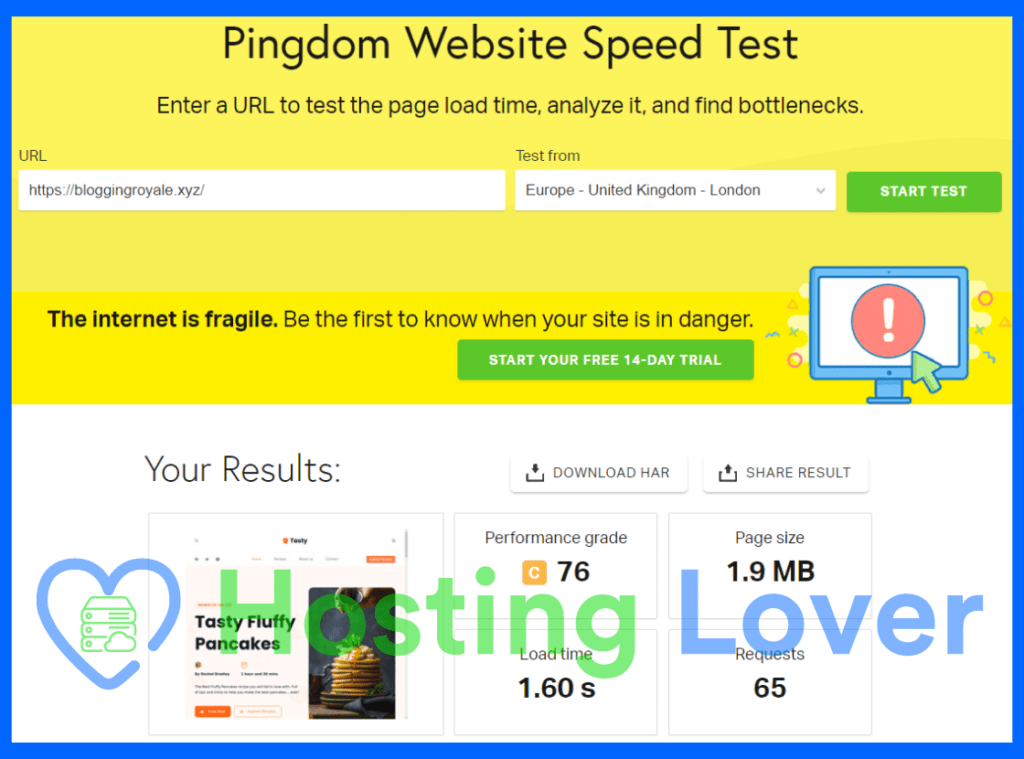
Test 2 is done in Pingdom tools with 7 different worldwide locations. Pingdom test results are consistent by test by test. So, I can take one test and it will be good.
| Server Location | Performance grade | Load time | Page Size |
|---|---|---|---|
| Tokyo – Japan | 76 – C | 2.60 s | 1.9 MB |
| Frankfurt – Germany | 76 – C | 1.59 s | 1.9 MB |
| London – UK | 76 – C | 1.60 s | 1.9 MB |
| Washington D.C. – USA | 76 – C | 0.76 s | 1.9 MB |
| San Francisco – USA | 76 – C | 1.22 s | 1.9 MB |
| Sydney – Australia | 78 – C | 3.22 s | 1.9 MB |
| São Paulo – Brazil | 76 – C | 2.24 s | 1.9 MB |
| Global Average | 76 – C | 1.89 s | 1.9 MB |
Test 3
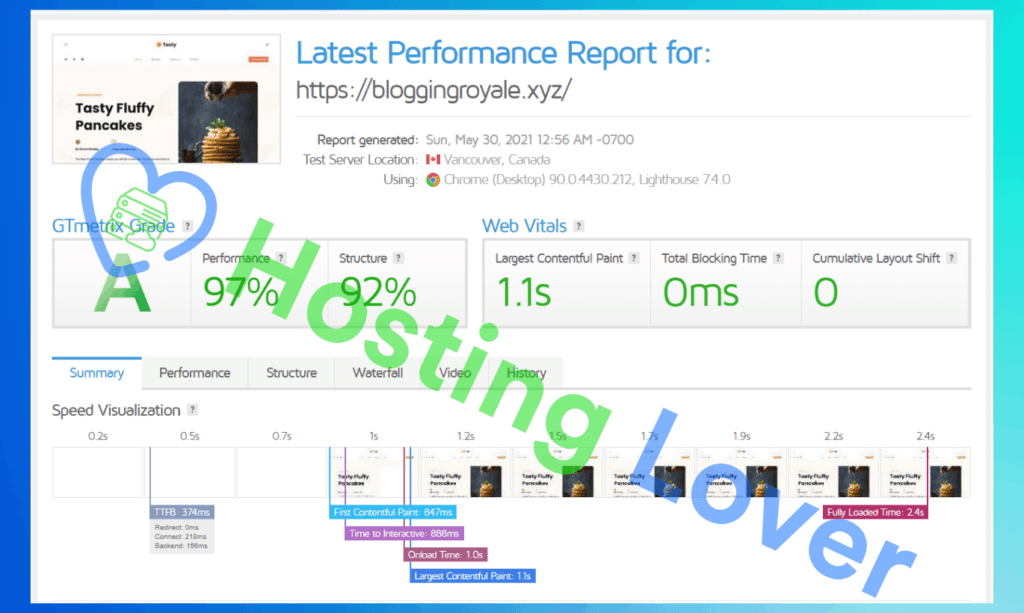
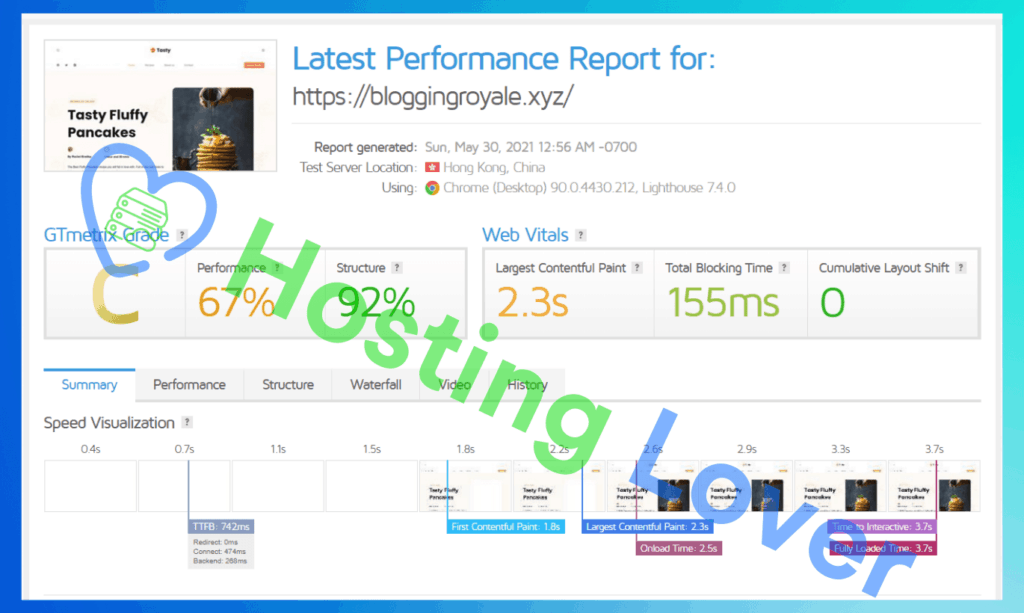
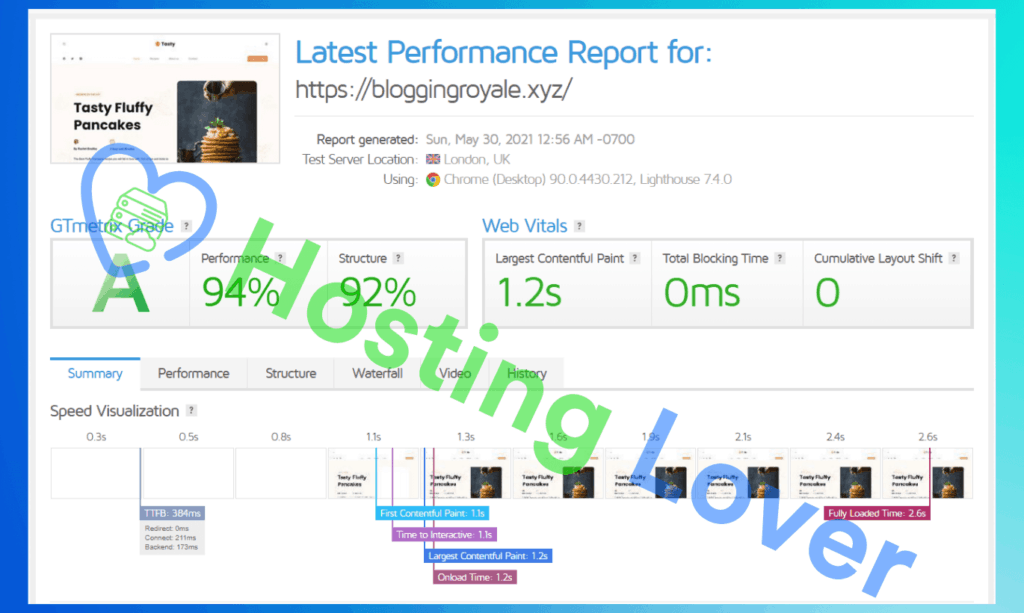
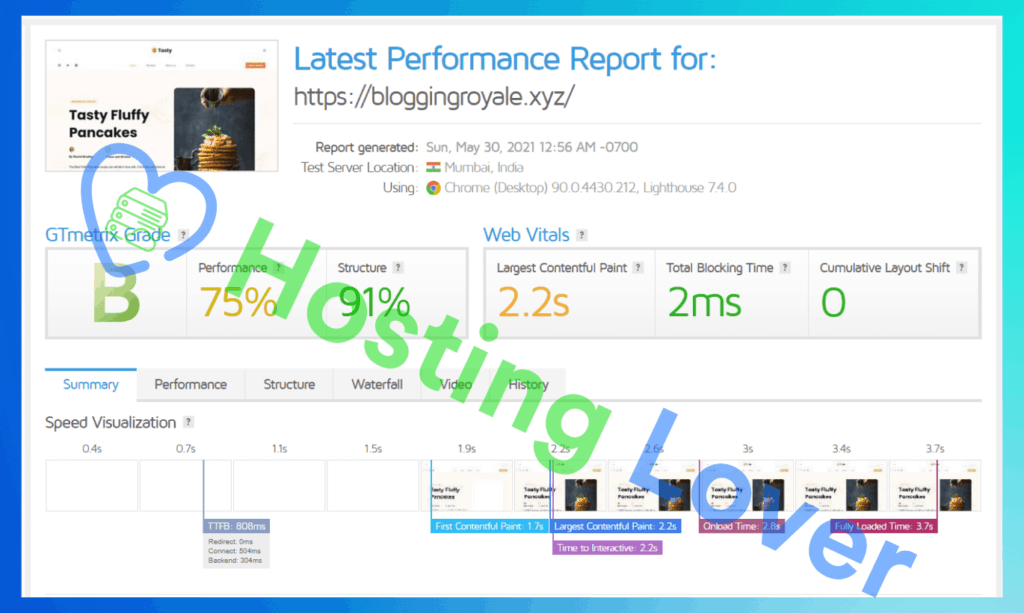
Test 3 is done in GT Metrix from 7 different worldwide locations.
| Server Location | Performance | First Contentful Paint | Time to Interactive | Speed Index | Onload Time | Fully Loaded Time |
|---|---|---|---|---|---|---|
| Vancouver, Canada | 97% | 847 ms | 888 ms | 918 ms | 1.0 s | 2.4 s |
| Hong Kong, China | 67% | 1.8 s | 3.7 s | 1.9 s | 2.5 s | 3.7 s |
| London, UK | 94% | 1.1 s | 1.1 s | 1.1 s | 1.2 s | 2.6 s |
| Mumbai, India | 75% | 1.7 s | 2.2 s | 1.9 s | 2.8 s | 3.7 s |
| San Antonio, TX, USA | 97% | 890 ms | 962 ms | 924 ms | 1.0 s | 2.5 s |
| Sydney, Australia | 76% | 1.6 s | 1.8 s | 1.8 s | 2.5 s | 3.3 s |
| São Paulo, Brazil | 86% | 1.4 s | 1.4 s | 1.5 s | 1.6 s | 2.9 s |
| Global Average | % | 1.3 s | 1.72 s | 1.43 s | 1.8 s | 3.0 s |
Test 4
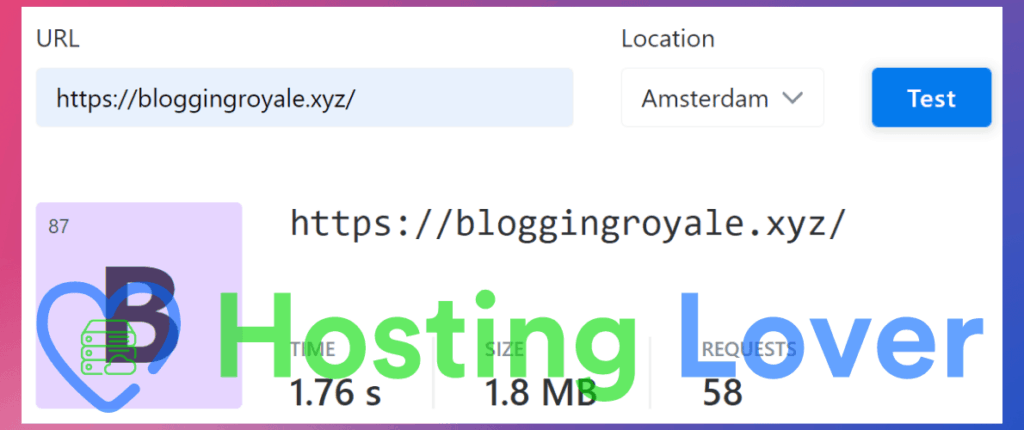
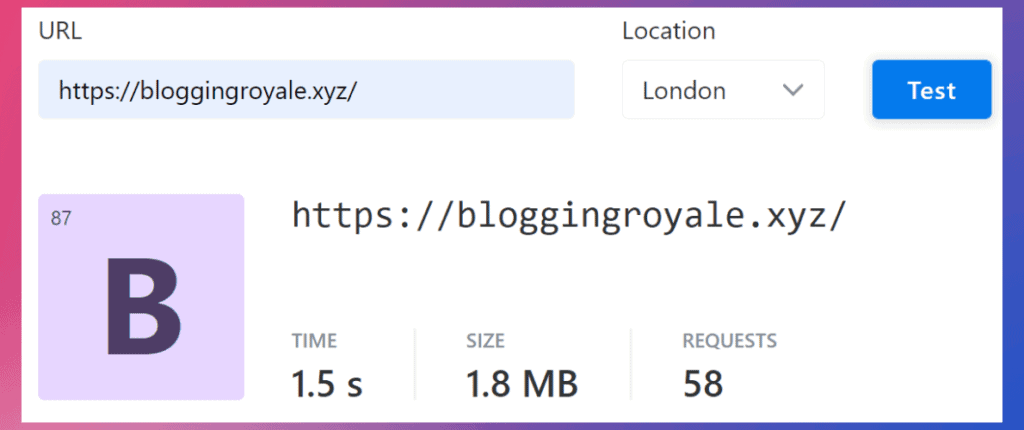
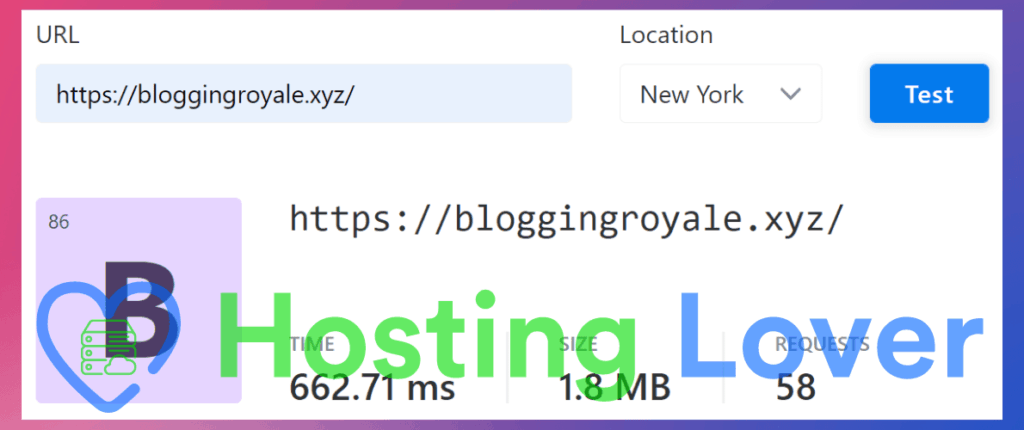
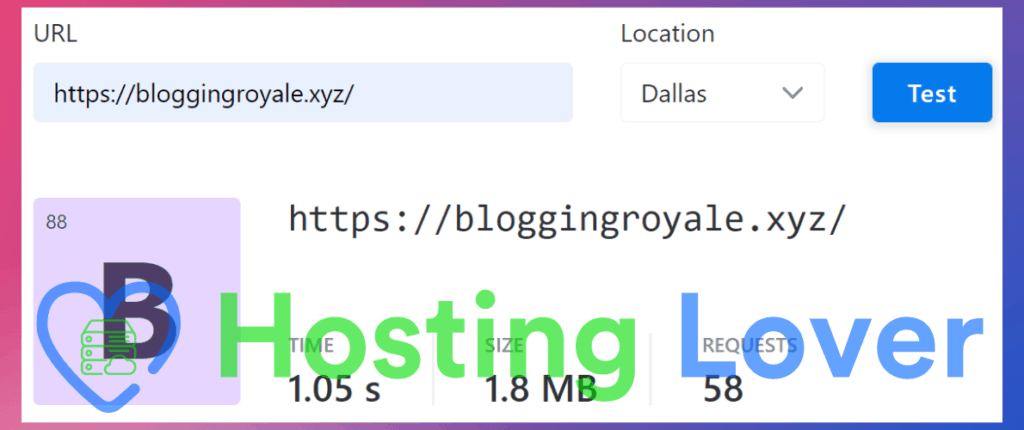
Test 4 is done from 10 different worldwide locations. By this test we can get average loading time of the website.
| Server Location | Score | Time |
|---|---|---|
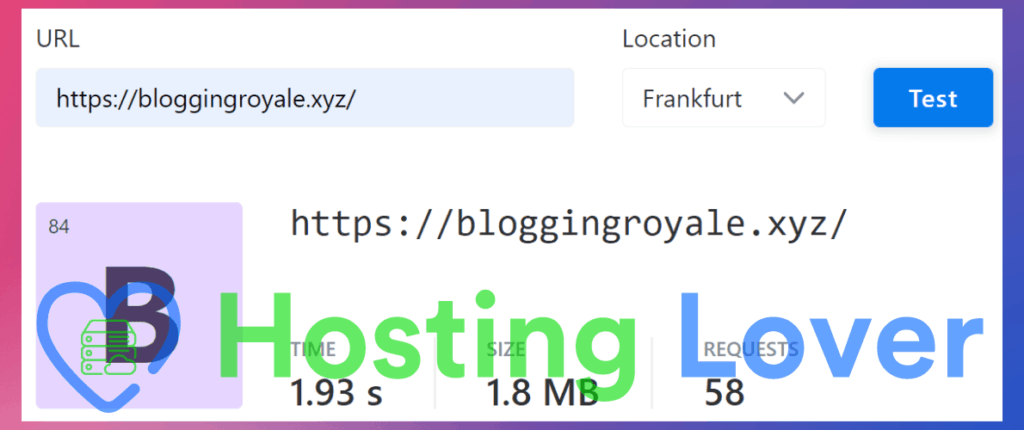
| Frankfurt | 84 | 1.93 s |
| Amsterdam | 87 | 1.76 s |
| London | 87 | 1.5 s |
| New York | 86 | 662.71 ms |
| Dallas | 88 | 1.05 s |
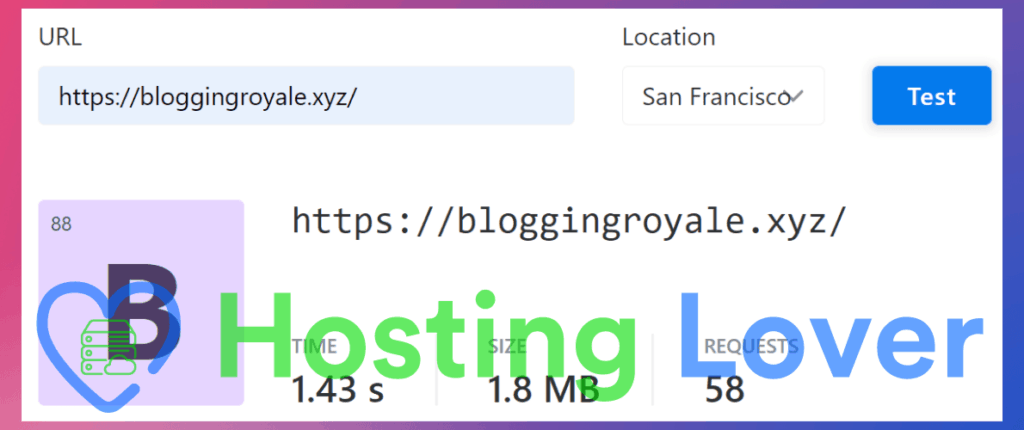
| San Francisco | 88 | 1.43 s |
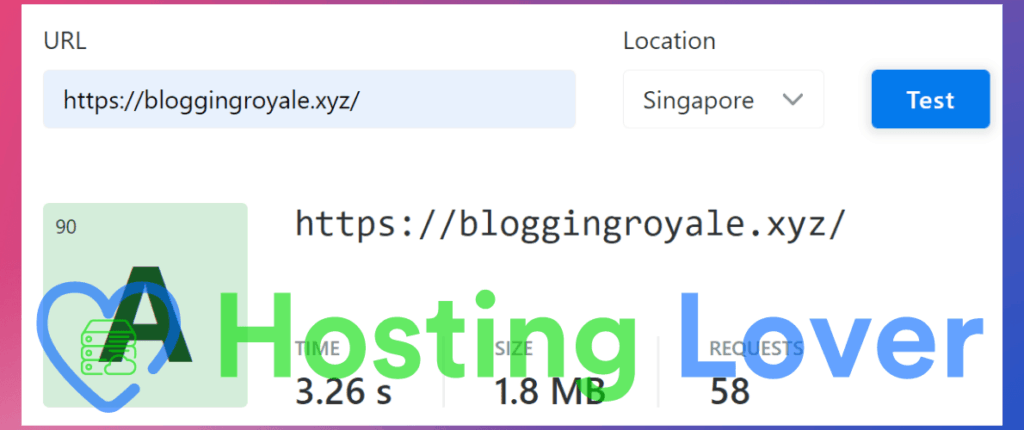
| Singapore | 90 | 3.26 s |
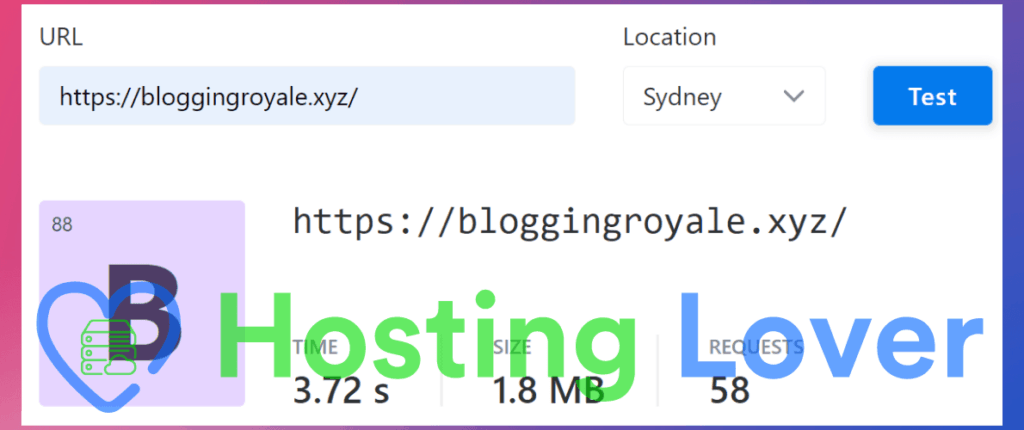
| Sydney | 88 | 3.72 s |
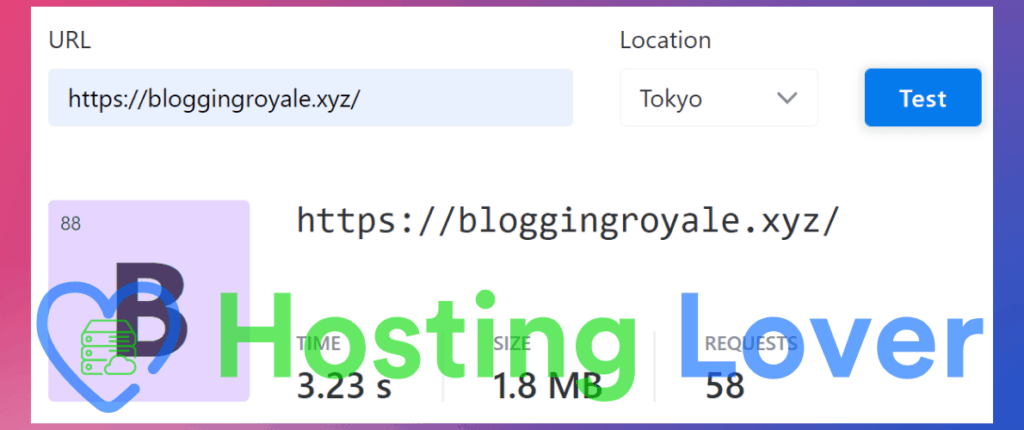
| Tokyo | 88 | 3.23 s |
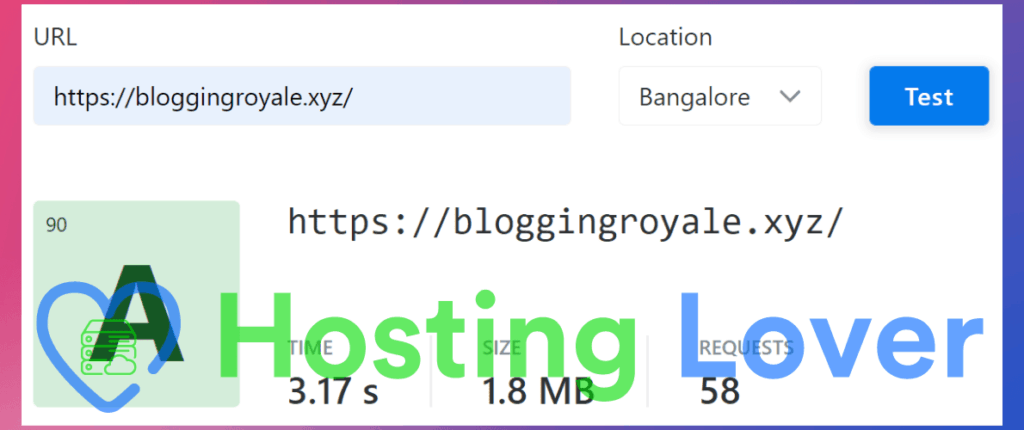
| Bangalore | 90 | 3.17 s |
| Global Average | 88 | 2.171 s |
Test 5
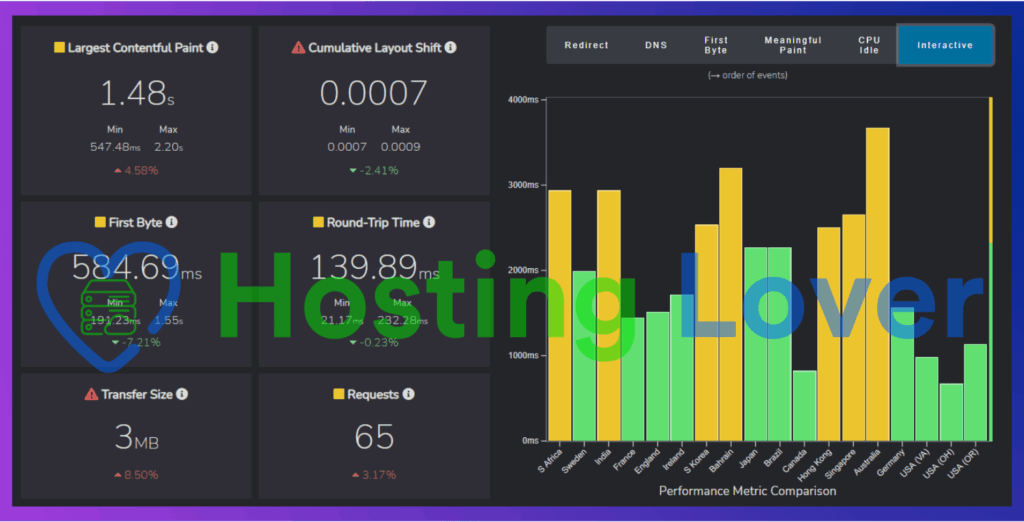
Test 5 is done from 18 different worldwide locations. In these results, we measure website interactive time.
The Time to Interactive (TTI) metric measures how long it takes a page to become interactive to the site visitor. A web page is interactive when it has displayed useful content, event handlers are registered for most visible page elements, and the page responds to user interactions within 50 milliseconds.
Useful content means the primary content of the page such as article contents and headlines and does not include header images, navigation, and other elements of a web page.
| Server Location | Interactive Time |
|---|---|
| S Africa | 2938 ms |
| Sweden | 1990 ms |
| India | 2934 ms |
| France | 1438 ms |
| England | 1517 ms |
| Ireland | 1716 ms |
| S Korea | 2529 ms |
| Bahrain | 3197 ms |
| Japan | 2268 ms |
| Brazil | 2266 ms |
| Canada | 817 ms |
| Hong Kong | 2503 ms |
| Singapore | 2650 ms |
| Australia | 3670 ms |
| Germany | 1559 ms |
| USA (VA) | 982 ms |
| USA (OH) | 665 ms |
| USA (OR) | 1127 ms |
| Global Average | 2042 ms |
Final Results
Global Average TTFB: 470 ms
Average Fully loaded Time: 2.1 s
Conclusion
That’s it guys, for Hostinger Shared Hosting Speed Test. You can use my affiliate link to purchase any of the products. By doing this you will get a special discount and I will receive a small commission. So I can test more hosting without any sponsorship and provide honest reviews to you guys.









You are wonderful! Thank you!